Credit Scorecard and Probability of Default (PD) Implementation

Roopya uses Application Data and Bureau Data in addition to various Alternate data, as applicable, to implement a credit scorecard. We apply quantitative criteria to find the best model, highlighting its key qualities as an effective scorecard.

Using data from loan applications, we implement the essential steps, including data preparation, selecting important features, converting variables using the Weight of Evidence (WOE) method, building the logistic regression model, conducting thorough evaluations, and ultimately creating a credit scoring system.

SCHEDULE A DEMO

A credit score is a numerical representation of a customer's creditworthiness. There are two main categories of credit scoring models: application scoring and behavioural scoring. Application scoring is used to evaluate the risk of default when a customer applies for credit, using data like demographic information and credit bureau records. Behavioural scoring, on the other hand, assesses the risk associated with existing customers. This is done by examining their recent account transactions, current financial data, repayment history, any delinquencies, credit bureau information, and their overall relationship with the bank. Identifying high-risk clients enables the bank to take proactive measures to protect itself from potential future losses.

Steps followed by Roopya in Credit Scorecard Implementation:

Feature Benefits How Roopya Helps
Data Collection and Integration Gathers and cleans data from various sources for holistic analysis.
  • Connects to internal systems, credit bureaus, and public databases.
  • Cleans and standardizes data for consistent analysis.
  • Handles missing data imputation and outlier detection.
Feature Engineering Creates new features to improve model performance and capture hidden insights.
  • Provides tools for calculating ratios, transforming variables, and creating interaction terms.
  • Suggests relevant features based on domain knowledge and data analysis.
  • Allows customization of feature creation based on specific needs.
Model Selection Offers various modeling techniques (Logistic Regression, Decision Trees, Gradient Boosting, etc.) to fit different data and needs.
  • Guides in choosing the most suitable model based on data characteristics and scoring objectives.
  • Provides automated model comparisons and performance metrics.
  • Allows for experimentation with different models and feature combinations.
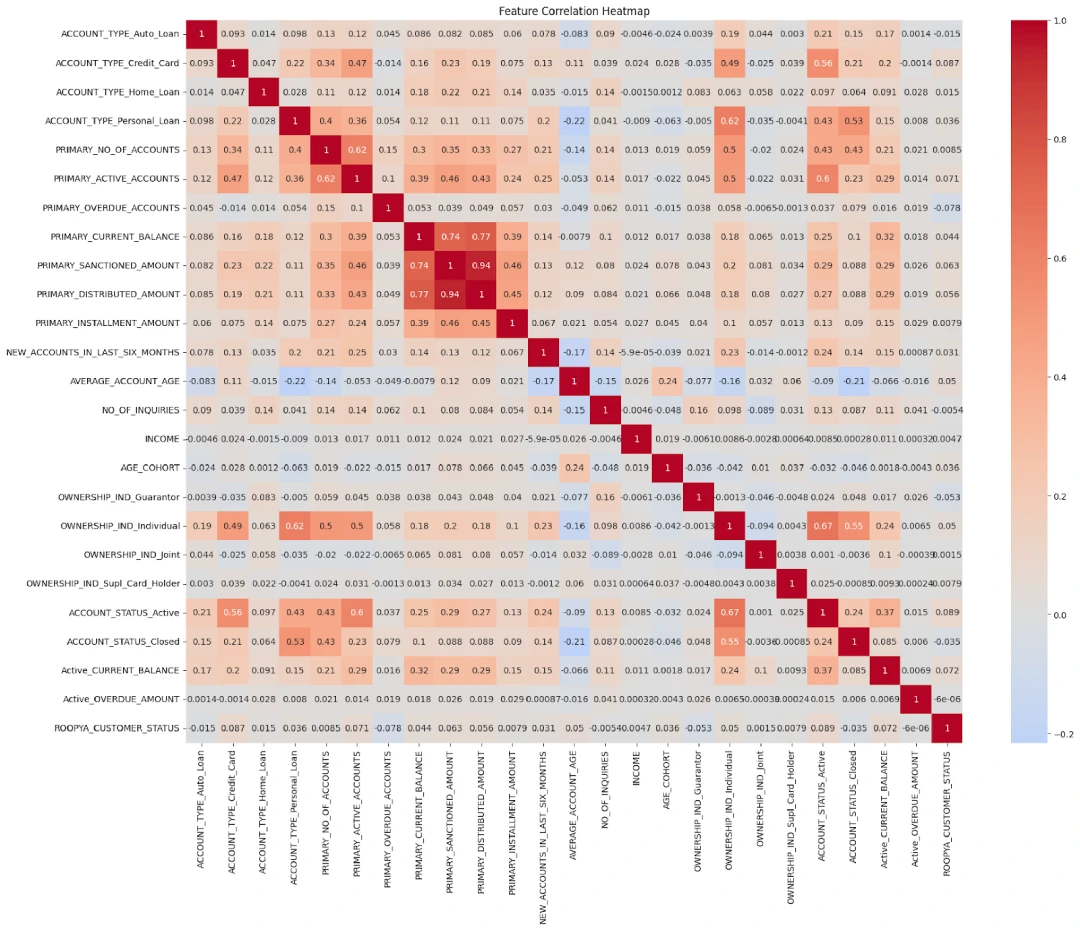
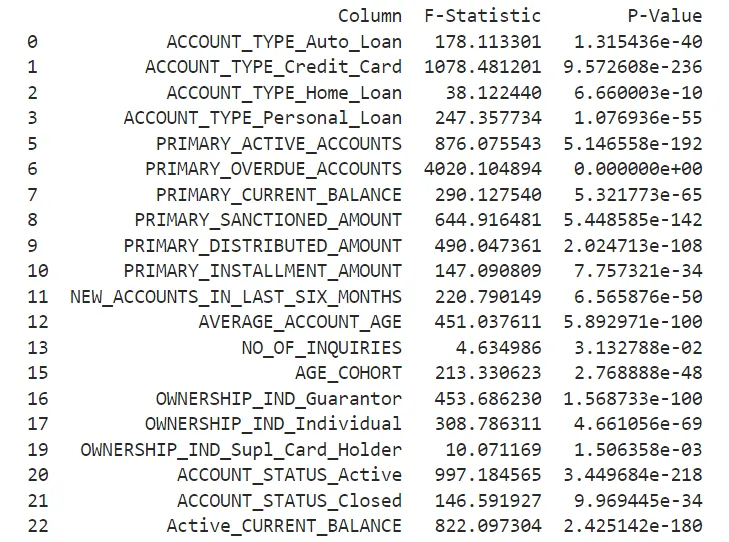
Automatic Feature Selection Identifies the most relevant features for the model, saving time and effort.
  • Utilizes advanced algorithms like LASSO and feature importance ranking.
  • Reduces model complexity and improves interpretability.
  • Helps avoid overfitting and enhances model generalizability.
Model Calibration and Validation Ensures model outputs accurately reflect the true risk of default.
  • Calibrates models to ensure predicted probabilities match actual default rates.
  • Provides backtesting tools to evaluate model performance on historical data.
  • Offers tools for stress testing and assessing model sensitivity to changes.
Scorecard Generation Generates customizable scorecards based on the chosen model and scoring methodology.
  • Creates scorecards with clear score ranges, risk categories, and decision rules.
  • Allows defining scorecard granularity and weightings for different factors.
  • Provides various scorecard visualization options for better understanding.
API Integration Integrates scorecard with existing lending systems for automated credit decisions.
  • Offers APIs for seamless integration with loan origination and decisioning systems.
  • Enables real-time scoring and automated decision making based on score thresholds.
  • Improves efficiency and reduces manual intervention in credit decisions.
Monitoring and Reporting Tracks scorecard performance over time and identifies changes in risk factors.
  • Provides dashboards and reports for monitoring key metrics like accuracy, stability, and fairness.
  • Tracks changes in borrower behavior and market conditions that might impact risk.
  • Generates alerts for potential issues and prompts for model retraining if needed.
Explainability Provides explanations for score decisions, improving transparency and fairness.
  • Offers feature importance analysis to understand what factors contribute to the score.
  • Generates explanations tailored to specific borrowers and regulatory requirements.
  • Helps build trust and understanding with borrowers about credit decisions.
Regulatory Compliance Ensures adherence to relevant regulations and best practices.
  • Provides built-in checks for compliance with industry standards like Fair Isaac and Dodd-Frank Act.
  • Offers audit trails and documentation for regulatory reviews.
  • Updates platform according to changing regulatory requirements.
Scalability Handles large data volumes and complex scoring requirements.
  • Cloud-based infrastructure scales to accommodate growing data volumes and user base.
  • Supports complex models and scoring methodologies for diverse lending needs.
  • Provides flexibility for customization and future expansion.

Types of Credit Scorecards Implementation by Roopya

Roopya Credit scorecards are designed for different stages of the customer lifecycle: application, behavioural, and collections. These scorecards assess credit risk but differ in their focus, data used, and the decisions they inform. Below is a factual comparison in tabular format:

Feature Application Scorecard Behavioral Scorecard Collection Scorecard
Purpose To assess the risk of new applicants and decide on granting credit. To monitor existing customers’ credit behaviour and manage account relationships. To predict the likelihood of recovering debt from delinquent accounts and strategize collection efforts.
Data Used Relies on data available at the time of application such as credit history, income, employment status, and debt-to-income ratio. Uses account behaviour data like payment history, credit utilization, and changes in spending patterns. Focuses on delinquency-specific data including the duration of debt, amount owed, past payment behaviour, and response to previous collection efforts.
Example A bank uses an application scorecard to evaluate a loan application. It considers the applicant's credit score, annual income, and employment history to decide approval and set terms. A credit card company uses a behavioural scorecard to adjust credit limits based on customers' spending and repayment patterns over the last 12 months. A collection agency employs a scorecard that prioritizes accounts for action based on the amount overdue and the historical responsiveness of the account holder to collection attempts.
Decision Impact Determines whether to approve or reject credit applications and under what terms (e.g., interest rate, credit limit). Used for managing existing accounts, such as offering credit limit increases, adjusting interest rates, or identifying accounts for closer monitoring. Helps in prioritizing collection efforts on accounts, deciding on the intensity of follow-ups, and potentially negotiating settlements.
Timing Applied at the beginning of the customer lifecycle, at the point of credit application. Utilized throughout the customer lifecycle for ongoing risk management and relationship optimization. Activated after an account becomes delinquent and enters the collections process.

Evaluation Metrics For Scorecard Performance

Several evaluation metrics are calculated to assess the model's performance, including:

  1. Accuracy
  2. F1 Score
  3. Precision
  4. Recall
  5. ROC-AUC Score
  6. The Receiver Operating Characteristic (ROC) curve is generated to visualize models good bad classification power.
  7. A classification report provides detailed metrics for both classes (Class 0 and Class 1).
  8. True Negatives (TN), False Positives (FP), False Negatives (FN), and True Positives (TP) are determined using a confusion matrix.

Sample Model Performance Hyperparameters:


The below image shows the ROC Curve and ROC-AUC Score of the model:

Sample Correlation Heat Map Between Variables

Sample p-values for each column and checked that these columns are significant for this model.


Here's a sample table summarizing the performance metrics for the three models: Logistic Regression, Random Forest Classifier, and XGBoost Classifier.

Metric Logistic Regression Random Forest Classifier XGBoost Classifier
Accuracy 0.7678 0.9665 0.9686
F1 Score 0.8608 0.9829 0.9840
AUC-ROC Score 0.8386 0.8169 0.8438
Gini Coefficient 0.6692 0.6337 0.6876
Precision 0.9896 0.9699 0.9699
Recall 0.7627 0.9964 0.9984
Specificity 0.7678 0.0476 0.0486

Final Scorecard Production

We will deliver the final scorecard detailing each steps, from initial data analysis to scaling and categorizing the scores.

Before producing the final scorecard, we conduct initial characteristic analysis and logistic regression on the dataset to identify relevant characteristics and their coefficients.

Seamless

|

Standardized

|

Compliant

Best In-class Featuresimg

  • Easily create customized forms and applications
  • Track and monitor loan applications
  • Verify identities and documents
  • Provide a self-service portal for customers on both web and mobile platforms
  • Pre-built reporting and MIS capabilities
  • Designed with security and data privacy as a top priority
  • Configurable workflows to accommodate multiparty products
  • Credit risk assessment and modeling
  • Financial insights for underwriting and decision-making
  • Process enforcement and audit trails
  • Fully customizable to meet your business needs